
Optimal Target Strategy
As a long time strategic golfer, I have known to not aim at pins tucked away on the edge of the green and to be play safely away from trouble. Since the advent of strokes gained and DECADE, there has been a lot of interest in this strategy with strokes gained giving us a detailed way to measure performance of each shot, and DECADE quantifying where you should be aiming, but a not a lot of proof in terms of why that is so. Some people still hold the belief that if you are playing to win, then you need to fire at pins, and playing conservatively will not help you shoot low, which obviously gets some push back from the proponents of DECADE and the like, but I’ve not seen much data on the issue, so I tried to simulate the different target selection strategies to determine what the optimal strategy is.
Methodology
Simulating Approach Shots
The approach shot is simplified down to a one dimensional model of a green with a pin tucked on the left hand side next to a bunker. The pin is located 5 yards from the edge of the green, with 1 yard of fairway between the green and the bunker. There are 24 yards of green to the right of the pin, with 1 yard of fairway and then rough. The Strokes From for distance to the pin and the lie are shown in the bottom of the figure. The shot distribution is assumed to be a normal distribution centered on the players target with a standard deviation of 9.5 yards, which has a 80% one-sided distribution of 8 yards. This means that 80% of shots will end up right of 8 yards left of target. The shot distributions for aiming at the pin and the optimal target (see below) are shown in the top of the figure.

Optimal Target
The optimal target for this approach shot can be calculated by integrating the shot distribution for a given target over the expected strokes from the distance and lie from the stroke gained tables in Mark Broadie’s book.
\[\int_{-\infty}^{\infty} P(x|\mathrm{target}) \mathrm{SF}(x) dx\]$P(x|\mathrm{target})$ is the normal probability distribution over $x$ (the distance from the pin) for a given target, and $\mathrm{SF}(x)$ is the strokes from that position given the distance to the pin ($x$) and the lie.
This is the equivalent of multiplying the curves on the top and bottom of the figure and seeing which has the smallest area (since we are trying to minimize the strokes from) under the resulting convolution of the two curves.
Calculating this for the simplified model described above, gives us an optimal target of 4.6 yards right of the pin. The optimal target and expected shot distribution compared to aiming at the pin is shown in the first figure. This seems to be inline with the target given by DECADE. Which for a shot of 160 yards (which has a 80% distribution of about 8 yards by my own personal measurements), the DECADE number would be 8, and with a bunker so close to the edge of the green we would probably give a 2 difficulty, so we would aim 10 yards away from the edge of the green, and for this case the optimal target is 5+4.6 yards from the edge of the green.
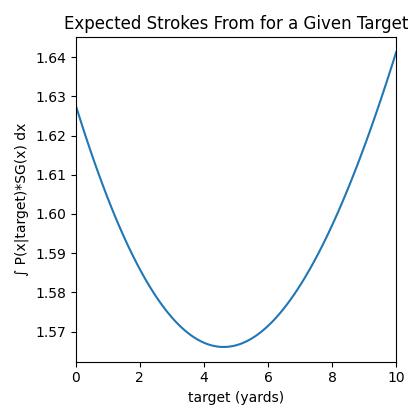
This figure shows that the optimal target is an improvement of 0.06 strokes over aiming directly at the pin. While not much for a single shot, this adds up to a shot at the end of the round or 4 shots over the course of a tournament.
Simulating Rounds
Each approach shot is simulated by sampling from this probability distribution, with the sample being the distance from the pin, with negative numbers being left, and positive numbers being right of the pin. The expected shots from finish location of the approach shot is calculated using strokes gained using the distance and lie from that spot. For a round of golf 18 approach shots from this standardized approach shot are simulated, the strokes gained from final location of each shot added to the 18 shots, and 40 shots added for all other shots, for example tee shots. The score for the round is then rounded to the nearest integer, since the strokes gained is non-integer.
Simulating Tournaments
For a tournament, 143 players are in the field, with a different target cohorts for the approach shots. Each player aims consistently at the same target relative to the pin for all approach shots. The targets are integer values of 0 to 10, which correspond to aiming at the pin for all approach shots (0) up to aiming 10 yards right of the pin. There are 13 players for each target cohort from 0 to 10, totalling 143 players (13*11). The scores are simulated for each player for each round, with a cut to the top 70 and ties after the first two rounds, with the tournament totalling 4 rounds.
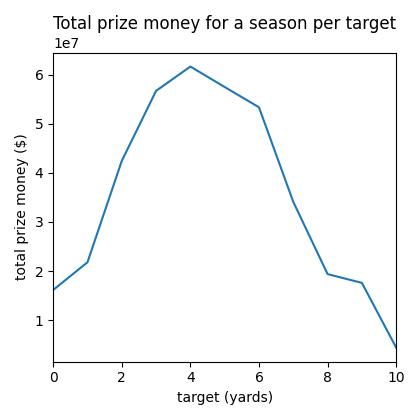
The prize money for each tournament is set at $2,250,000 for the winner with the standard distribution of payouts as seen in top level professional events. Prize money is split between ties (with no playoff for first place), and is only given out to those players making the cut.
The tournament season is simulated for 30 events, with all players playing in all 30 events and playing for the same prize money for each event. The total prize money, wins, and top places, and made cuts are summed up across target cohorts.
Results
The average prize money accumulated by each cohort of targets for each player was calculated, and you can see a clear peak around the same target as the optimal target from strokes gained.
The total placed finishes summed over cohorts also takes a similar pattern with peak in the number of wins, top 3, 10, and 25 and number of made cuts per target cohort. So it seems from the simulations, that it doesn’t matter if you are playing to win an event or just maximum you prize money over time, the optimal target in a tournament, all things being equal is still to play to the optimal target and not fire at pins all day.
| target | wins | top 3 | top 10 | top 25 | cuts made |
|---|---|---|---|---|---|
| 0 | 1 | 3 | 20 | 35 | 161 |
| 1 | 1 | 4 | 19 | 56 | 182 |
| 2 | 5 | 17 | 38 | 92 | 239 |
| 3 | 7 | 21 | 64 | 118 | 247 |
| 4 | 9 | 19 | 65 | 124 | 270 |
| 5 | 5 | 21 | 56 | 120 | 279 |
| 6 | 7 | 17 | 54 | 119 | 262 |
| 7 | 3 | 4 | 33 | 84 | 242 |
| 8 | 0 | 3 | 17 | 52 | 203 |
| 9 | 2 | 5 | 10 | 40 | 171 |
| 10 | 0 | 0 | 1 | 7 | 100 |
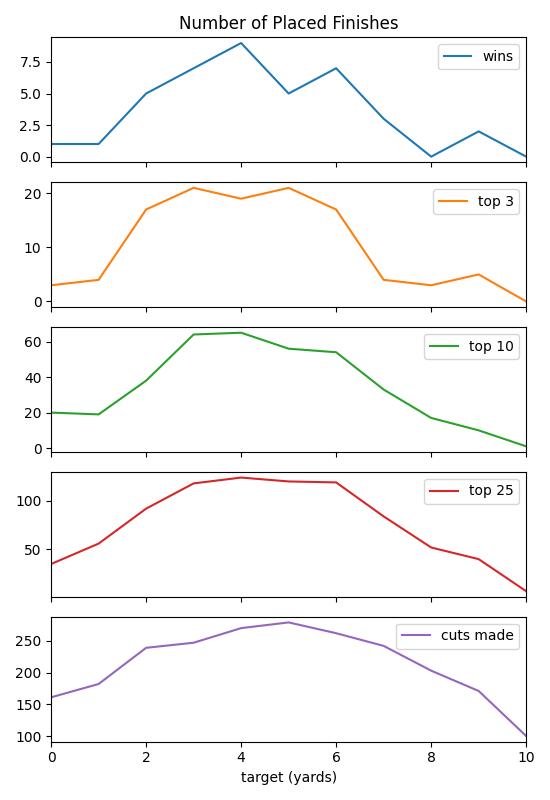
This shows that the optimal strategy over the course a 30 round season of 4 round tournaments, is to aim at the optimal target and not fire at pins. Even if you were just trying to maximize your wins without optimizing for overall performance over the season, the optimal strategy is still to aim at the optimal target. Firing at pins does not seem to work even if just going for the win for one tournament.
If you were the only guy in the field playing to the optimal target and everyone else is firing at pins all day, then we can rerun the simulations and show that in that case the guys firing at pins would win, but that just means that the advantage is not enough to overcome the odds of 142 other guys with the same ability firing at pins. But that doesn’t mean if you then also fire at pins all day that you would do better, on the contrary, you would then just be another playing in the field with odds of winning at 143:1. You have better odds being the guy aiming at the optimal target, just not enough to win against those odds.
The code to reproduce these simulations is available here.
References
[1] Mark Broadie, Every Shot Counts, 2014 | ISBN 9781592407507 [2] DECADE
Comments